
Manufacturing
OEE Optimization
A regional bottling plant was losing 15% of its daily output to unexplained downtime. We transformed their manual logs into a live OEE tracking system.

The Challenge
The plant relied on paper-based shift reports. Management discovered production dips 24 hours late, making it impossible to diagnose root causes like micro-stoppages on the labeling line.
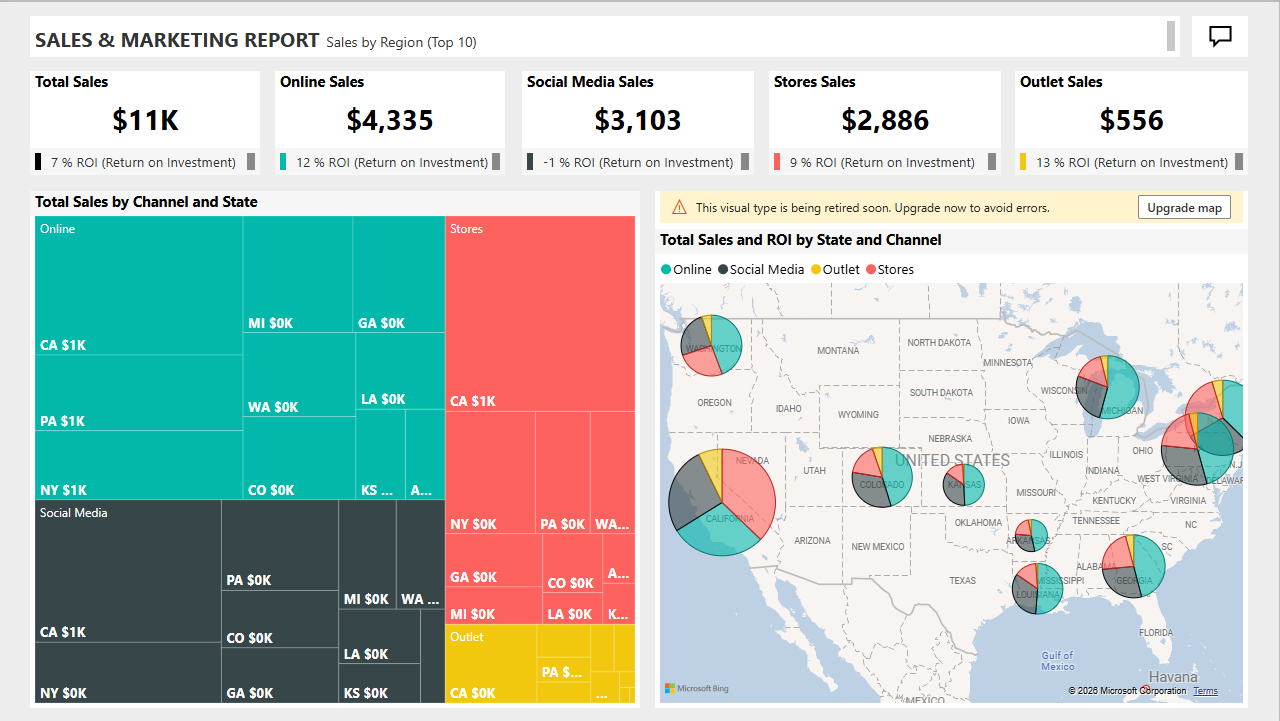
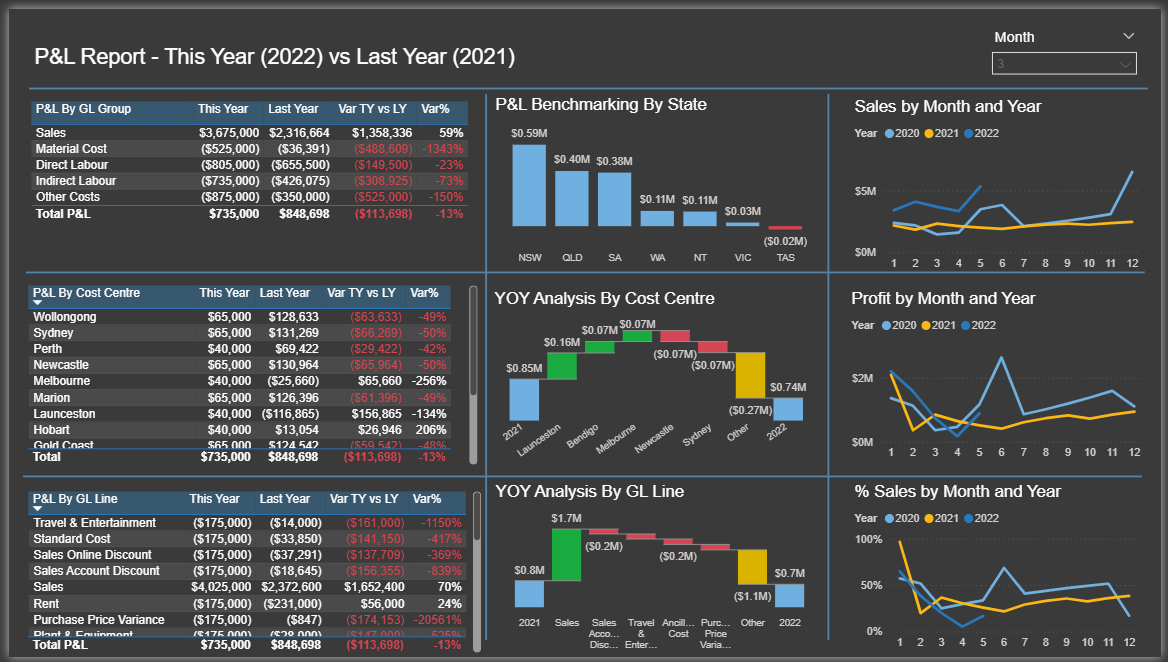
The Eracle Solution
- Built a Power BI dashboard connecting to floor-level sensors.
- Implemented an automated "Alert System" for speed drops.
- Created comparative shift-analysis for operator training.
Throughput
Scrap Reduction
Saved Annually
Logistics & Warehousing
99% Inventory Accuracy
Manual data entry across three spreadsheets caused "Phantom Inventory"—items showed as 'available' in the office but were missing from bins.
The Eracle Solution
- Developed a QR-code-integrated Excel system for mobile updates.
- Automated reconciliation between sales orders and physical stock.
- Created seasonal forecasting tools for low stock.
Stock Accuracy
Fulfillment Errors
Audit Compliance
Civil Engineering
Stopping Budget Leaks in Mid-Rise Development
Field managers were ordering materials without visibility into the remaining project budget, leading to 20% over-spending.
The Eracle Solution
- Built a cloud-synced requisition tool for site supervisors.
- Automated labor-cost tracking linking attendance to payroll.
- Designed a visual "Heatmap" for over-spending phases.
Budget Saved
Cost Clarity
Labor Tracking
Retail & Distribution
Optimizing Stock Distribution for Fashion Retail
Distribution was based on branch manager "gut feeling," leading to city-wide stock imbalances.

The Eracle Solution
- Consolidated 20 locations into a single Power BI model.
- Calculated "Sales Velocity" per SKU to find moving items.
- Automated "Stock Balancing" transfer reports.
Markdowns
Stock Turn
Stores Linked
Non-Profit / NGO
Grant Transparency for International NGO
An NGO needed to prove the impact of a $2M grant. Field data from four countries arrived in inconsistent, messy formats.
The Result
Reporting time was reduced from 21 days to 2 hours. High transparency led the donor to renew the grant for an additional three years.
Admin Speed
Grant Secured
Countries Linked
Professional Services
Improving Billable Utilization for Creative Agency
Projects were missing deadlines while some departments were under-utilized. We built a Resource Capacity Tracker.
Utilization
More Capacity
Forecasting
Education
Predicting Student Churn for Private Institution
Admin only realized a student was leaving when they failed to pay tuition. We built a predictive student-at-risk tracker.

Retention
Rev Recovery
Alert System
Finance & Auditing
Automated Reconciliation for Holding Company
A holding company with 5 subsidiaries spent 10 days a month reconciling thousands of transactions.
Monthly Work
Hours Saved
Audit Findings
Healthcare
Reducing Patient Wait Times via Flow Data
Theater slots were allocated based on fixed blocks rather than actual surgery durations. We optimized their scheduling logic.
Theater Efficiency
Wait Times
Extra Op/Week
Real Estate & Property
Proactive Maintenance for Property Management
A property firm was bleeding cash on emergency repairs. We moved them to a data-driven "Proactive Maintenance" model.
Repair Costs
Portfolio Yield
Capex Forecast