
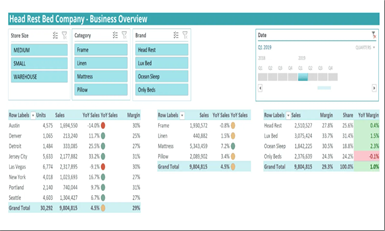
Dashboard Development
Turning Data into Decisions
In the modern business landscape, "gut feeling" is no longer a viable strategy. Interactive dashboards provide the clarity needed to lead with confidence.
Managers and executives are often inundated with data, but without a way to visualize it, that data is just noise. Business Reporting and Dashboard Development is the process of synthesizing raw information into interactive, visual snapshots that tell a compelling story about business health.

Why Businesses Need High-Quality Reporting
Most managers spend 80% of their time gathering data and only 20% analyzing it. High-quality dashboards flip that ratio. By centralizing KPIs into a single view, businesses can identify bottlenecks in production, spikes in sales, or lulls in delivery efficiency in real-time.
Core Components of an Effective Dashboard
A great dashboard is more than just a collection of charts; it is a functional tool designed for specific outcomes. Key components include:
- KPI Tracking: Identifying the 3–5 metrics that actually move the needle for a specific department.
- Interactivity: Using slicers and filters so a user can look at "Total Sales" or drill down into "Sales by Region."
- Trend Analysis: Comparing current performance against historical data or targets (e.g., YoY growth).
- Automated Data Refresh: Ensuring the dashboard stays current without manual copy-pasting.
Specific Applications
Our reporting systems are tailored to the unique needs of different organizational levels:
Production Dashboards: Monitor machine uptime, scrap rates, and hourly output to ensure manufacturing targets are met. Sales Tracking: Visualize conversion rates, lead sources, and individual sales rep performance. Supervisor Reporting: Give floor managers a quick view of team attendance and task completion.
Real-World Example
A regional logistics firm was struggling with delivery delays. By developing a real-time "Delivery Performance Dashboard," they identified that 40% of delays happened at a specific warehouse during shift changes. With this insight, they adjusted the schedule and reduced delay costs by 15% in the first month.
Conclusion
By implementing professional dashboards, you aren't just buying "a chart"—you are investing in clarity. You are providing the tool that allows a CEO to sleep better at night because they can see exactly how the business is breathing in real-time.
Report Automation
Killing the Manual Grind with Automation
The most expensive resource in any company is human time. Automation reclaims that time, allowing your team to focus on growth rather than data entry.
Thousands of hours are wasted every year on "spreadsheet drudgery"—manually copying data from one sheet to another, formatting rows, and sending repetitive emails. Excel Automation uses advanced formulas, Power Query, and VBA to build "set it and forget it" systems.
The Power of Automation
Imagine a process that currently takes a staff member four hours every Friday. Through a custom-built automation tool, that process can be reduced to a single click of a button. This isn't just about speed; it's about accuracy. Humans make typos; well-written code does not.
Key Service Offerings
We build tailored solutions that bridge the gap between software and spreadsheets:
- Inventory Tracking: Systems that alert users when stock is low and generate "Reorder Sheets" automatically.
- Form-Based Entry: User-friendly interfaces (UserForms) to prevent accidental formula deletions or broken data.
- VBA-Powered Tools: Custom macros that handle complex logic, such as splitting a master file into 50 individual PDF reports.
- Workflow Bridges: Connecting accounting tools and CRMs so data flows seamlessly into Excel.
Why Clients Invest in Automation (ROI)
Clients invest in automation because of the immediate Return on Investment. If a tool saves an employee five hours a week, the system typically pays for itself in less than three months. It is a "productivity multiplier" that allows small teams to behave like large corporations.
Real-World Example
A medium-sized agency spent two days every month generating client invoices. We developed a VBA-powered automation system that pulled project hours directly from their tracker into branded invoices. The entire process now takes 15 minutes, saving them over 20 billable hours per month.
Practical Tips for Automation
- Always include error-handling in your VBA code.
- Use Power Query for data cleaning before using VBA for formatting.
- Document your automation steps for future maintainability.
- Regularly audit automated outputs to ensure source data remains consistent.
Conclusion
Automation is no longer a luxury; it is a requirement for operational efficiency. By eliminating manual workflows, organizations reduce fatigue, increase data integrity, and significantly lower their overhead costs.
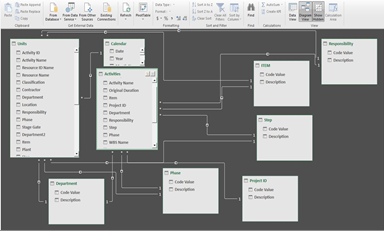
Data Cleaning and Mapping
The Foundation of Reliable Intelligence
You cannot build a skyscraper on a swamp. Similarly, you cannot build a reliable dashboard or an automated system on "dirty" data.
Data Cleaning and Structuring is often the "unsung hero" of data services, but it is the most critical step in the data lifecycle. Without structured data, the most expensive BI tools in the world will only produce "polished" misinformation.

What is "Dirty Data"?
Dirty data includes duplicate entries, inconsistent naming (e.g., "Apple Inc" vs. "Apple"), missing values, and poorly formatted dates. If a company runs a report on this, the results will be fundamentally wrong, leading to poor and potentially costly business decisions.
The Process: ETL (Extract, Transform, Load)
Our approach to structuring data follows a rigorous ETL framework to ensure maximum usability:
- Database Preparation: Converting raw exports from legacy systems into modern, structured formats.
- Power Query Transformations: Using scriptable logic to unpivot columns and merge disparate data sources.
- Data Standardization: Creating "Master Data" rules so every department uses the same naming conventions.
- Error Identification: Building "Audit Sheets" to flag missing or illogical data points automatically.
The Value Proposition: Trust
When you invest in data cleaning, you are buying Trust. You are giving your organization the confidence that when they see a number, that number is the absolute truth. This is essential for companies migrating to new CRMs or preparing for a financial audit.
Real-World Example
An e-commerce client had customer data spread across three different platforms. We used Power Query to merge these sources, deduplicate 15,000 records, and standardize address formats. This cleaning allowed them to run their first accurate "Customer Lifetime Value" analysis, revealing that 20% of their customers were responsible for 80% of their profit.
Conclusion
Reliable intelligence starts with a clean foundation. By prioritizing data structuring, businesses ensure their analytics are accurate, their automations are stable, and their strategic decisions are backed by verifiable facts.
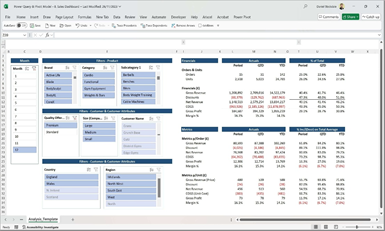
Power BI Reports & Dashboards
Unlocking Enterprise-Grade Insights
Modern analytics requires moving beyond flat files. Power BI provides a dynamic ecosystem for real-time data exploration and cross-departmental intelligence.
Design modern analytics dashboards that don't just show what happened, but explain why. By connecting disparate data sources, Power BI becomes the single source of truth for the entire organization.
Beyond Basic Charts
Unlike standard spreadsheets, Power BI allows for complex data modeling and deep-dive analysis. It enables executives to see the "Big Picture" while allowing managers to drill down into the smallest transaction details.
Key Service Offerings
- Executive Dashboards: High-level overviews of company health for C-suite decision-makers.
- Financial Performance: Automated tracking of P&L, balance sheets, and cash flow projections.
- Trend Analysis: Statistical modeling to identify seasonal patterns and market shifts.
- Cloud Integration: Connecting SQL databases, CRMs, and web APIs for live reporting.
Real-World Example
A multi-national manufacturer was using 15 different Excel files to track global sales. We implemented a unified Power BI model that consolidated data from every region. The result? A 50% reduction in monthly meeting times as everyone was finally looking at the same real-time data.
Conclusion
Power BI Setup is an investment in institutional intelligence. It transforms passive data into an active asset, fostering a culture of accountability and data-driven agility.
Operational Optimization
Designing Smarter Workflows
Efficiency isn't about working harder; it's about removing the friction that slows your team down.
We help companies design smarter workflows by auditing existing processes and implementing digital frameworks that eliminate waste. From the warehouse floor to the executive suite, optimized processes drive the bottom line.

Identifying Hidden Inefficiencies
Many business processes are "legacy"—they exist because "that's how we've always done it." We identify bottlenecks, redundant data entry points, and communication silos that drain productivity.
Frameworks for Success
- Production Tracking: Digital frameworks to monitor goods from raw materials to finished products.
- Warehouse Design: Optimizing picking, packing, and shipping routes through data analysis.
- System Integration: Ensuring your different software tools "talk" to each other to prevent manual data bridging.
Real-World Example
An e-commerce fulfillment center was struggling with a 12% error rate in order picking. By redesigning their warehouse logic and implementing a barcode-integrated tracking system, we reduced errors to under 1% and increased daily output by 25%.
Conclusion
Optimization is a continuous journey. By designing smarter workflows today, you build a resilient organization capable of scaling without a linear increase in overhead costs.
Training & Capacity Building
Empowering Your Workforce
The best systems in the world are useless if your team doesn't know how to use them. We bridge the gap between technology and talent.
We train teams to master Excel, reporting systems, and Power BI dashboards. Our goal is to create self-sufficiency, ensuring that your investment in data systems continues to pay off long-term.

Developing a Data-Literate Team
Data literacy is the new essential skill. We provide tailored workshops that move beyond "how to use a tool" and focus on "how to think with data."
Training Specializations
- Excel Masterclasses: Moving teams from basic entry to advanced automation and Power Query.
- Dashboard Literacy: Teaching supervisors how to interpret KPIs and act on trends.
- Custom System Onboarding: Specific training for the custom tools we build for your business.
Real-World Example
A finance department was overly dependent on one "Excel Guru." We conducted a 4-week intensive capacity-building program for the whole team. Now, the entire department can manage complex reporting, removing the single-point-of-failure risk.
Conclusion
Investing in your people is as important as investing in your software. Capacity building ensures that your team is confident, capable, and ready to leverage data for business growth.
Logistics Mastery
Inventory & Warehouse Solutions
Profit is often hidden in the warehouse. Poor tracking leads to stockouts, waste, and tied-up capital.
We build robust tracking tools for stock, deliveries, and logistics. Our systems provide total visibility into your supply chain, ensuring you have exactly what you need, when you need it.

The Science of Stock Control
Inventory management is a balancing act. Too much stock kills cash flow; too little stock kills sales. We use data to find the "Sweet Spot."
Core Deliverables
- Live Stock Dashboards: Real-time views of inventory levels across multiple locations.
- Movement Tracking: Auditable logs of every item entering or leaving the facility.
- Automated Reordering: Systems that trigger purchase orders when stock hits minimum thresholds.
Real-World Example
A distributor was losing $50k annually due to expired perishable stock. We implemented a FIFO (First-In-First-Out) tracking system in Excel that flagged items nearing expiration. Wastage dropped by 60% in the first six months.
Conclusion
A well-managed warehouse is a competitive advantage. Our solutions turn logistics from a cost center into a streamlined engine for customer satisfaction.
Custom Business Tools
Tailored Systems for Growth
Off-the-shelf software is often too complex or too expensive. Custom Excel-based tools provide the perfect "middle ground" for growing businesses.
We develop mini-systems tailored to your specific niche. These tools are lightweight, easy to use, and require no monthly subscription fees.

Bespoke Logic, Familiar Interface
By building systems within Excel, we leverage a tool your team already knows while adding powerful, custom functionality that matches your specific business rules.
Common Custom Solutions
- CRM Spreadsheets: Managing client leads and follow-ups without the cost of high-end software.
- Project Trackers: Custom Gantt charts and resource allocation tools.
- Expense & Budget Managers: Automated trackers for department spending and reimbursement.
Real-World Example
A construction contractor needed to generate complex quotes on-site. We built a custom "Quote Generator" that allowed them to input dimensions and materials on a tablet and instantly email a professional PDF to the client. Their conversion rate increased by 30%.
Conclusion
Custom tools solve specific problems without the "bloat" of enterprise software. They are flexible, scalable, and built entirely around how you do business.
The Science of Accountability
Performance Monitoring
What gets measured gets managed. Performance monitoring systems bring objectivity to team management and individual growth.
We design KPI frameworks and scorecards that align individual efforts with organizational goals. By creating transparency, we help leaders foster a culture of high performance and clear expectations.

Building a Culture of Results
Performance monitoring shouldn't be about surveillance; it should be about support. Clear metrics allow managers to identify who needs coaching and who is ready for promotion.
System Components
- Team Performance Trackers: Visualizing output against weekly and monthly targets.
- Departmental Scorecards: Providing a "Heatmap" of organizational health.
- Individual KPI Sheets: Personalized trackers that empower employees to own their success.
Real-World Example
A remote customer service agency struggled with inconsistent response times. We implemented a live performance leaderboard. Within weeks, average response times improved by 40% as the team gained clear visibility into their daily impact.
Conclusion
Standardized performance monitoring removes bias and replaces it with data. It provides the roadmap for continuous improvement and ensures the entire team is pulling in the same direction.
Reporting Templates
Professionalism at Scale
Consistency is key to a professional brand. Reporting templates ensure that every piece of data shared by your company looks boardroom-ready.
We provide reusable, automated templates for regular reporting. This ensures that even non-technical staff can produce high-quality, insightful reports in a fraction of the time.
Standardizing the Insight
When every department reports differently, it's impossible for leadership to compare results. Our templates provide a "Universal Language" for your data.
What’s Included?
- Branded Chart Styles: Pre-set color palettes and fonts that match your corporate identity.
- Automated Layouts: Sections that update automatically when new data is pasted in.
- Commentary Frameworks: Guided sections to help staff explain the "Why" behind the "What."
Real-World Example
A marketing firm spent 15 hours every month manually formatting "Client Performance Reports." We created a master template where they simply refresh the data source. Reporting time dropped to 30 minutes, and client feedback on report quality improved significantly.
Conclusion
Reporting templates are a productivity hack for the entire organization. They save time, reduce frustration, and ensure that your data is always presented with the professionalism it deserves.
Operational & Financial Auditing
Uncovering the Truth
Internal audits shouldn't just be about compliance; they should be about discovery. We use forensic data analysis to find leaks, errors, and opportunities.
Our auditing service goes beyond checking boxes. We dive into your ledgers and operational logs to ensure that what is happening on the ground matches what is reported in the books.

Beyond Traditional Audits
Traditional auditing is often reactive. Eracle’s data-driven approach is proactive, identifying anomalies in real-time before they become material weaknesses or financial losses.
What We Audit
- Revenue Assurance: Ensuring every sale is captured, invoiced, and collected without leakage.
- Process Compliance: Verifying that teams are following digital workflows and safety protocols.
- Inventory Reconciliation: Bridging the gap between physical stock-takes and digital records.
- Cost Variance: Analyzing "Budget vs. Actual" to find out exactly where projects are overspending.
Real-World Example
We conducted a forensic audit for a retail chain and discovered a 4% revenue leak caused by an incorrectly configured discount logic in their POS system. By fixing the data flow, we added $80k back to their annual bottom line.
Conclusion
Auditing with Eracle provides peace of mind. It ensures your organization is lean, compliant, and operating with a high degree of integrity and transparency.
Data-Driven Recruitment
Building High-Performance Teams
The cost of a bad hire is astronomical. We help HR departments use data to identify, track, and secure the best talent in the market.
From Applicant Tracking Systems (ATS) in Excel to recruitment funnel analytics, we provide the tools to make hiring a science rather than a guessing game.

Optimizing the Talent Pipeline
A successful recruitment strategy requires visibility. You need to know which channels are providing the best candidates and where talent is dropping out of your interview process.
Our HR Data Solutions
- Recruitment Dashboards: Tracking "Time to Hire," "Cost per Hire," and "Source Quality."
- Automated ATS: Lightweight, custom-built tools to manage hundreds of applicants without expensive software.
- Skill Gap Analysis: Using data to identify exactly what skills your current team lacks before you post a job.
- Candidate Scoring Models: Objective matrices to grade candidates based on data rather than bias.
Real-World Example
A growing tech firm was overwhelmed by 500+ applications per month. We built a custom screening tool that used keyword logic and scoring algorithms to highlight the top 5% of candidates instantly, reducing their initial screening time by 70%.
Conclusion
Your people are your most important asset. By applying Eracle’s data logic to your recruitment process, you ensure that you are building a team that is not only talented but perfectly aligned with your growth targets.